Junk Science

To be honest I am seeing a great argument in denial here.
So far we have...
- People working on Global Warming are biased and not to be trusted, people that discover aspects of it are not to be trusted because they weren't working on it.
- I have not read them therefore they cannot be right.
- I have no idea who they are but it is more likely they are wrong than right.
- I am open to changing my mind but I wont look at anything outside what I already know.

I have a tendency to accept work done and then repeated over the space 200 years as accurate, I suspect that almost all rational thinking folk do and I believe it is a very poor argument you are putting up on this topic and an exceedingly reckless one to try and discredit tried and tested work when you have done little more than read the local newspaper to formulate your own.
 
Last edited:
To be honest I am seeing a great argument in denial here.
So far we have...
- People working on Global Warming are biased and not to be trusted, people that discover aspects of it are not to be trusted because they weren't working on it.
I don't publicly throw my lot in with anyone unless, what they say agrees with what I see. You may, that is your prerogative.
- I have not read them therefore they cannot be right.
- I am open to changing my mind but I wont look at anything outside what I already know.
A self defeating argument. How could I have adopted my current view (what I already "know" as you put it), if your statement is true?
- I have no idea who they are but it is more likely they are wrong than right.
Nowhere did I say or indicate any of the above. Now I see why your interpretation of fact differs so widely from mine. You do put a marvellous spin on the words of others to suit your case, however on this occasion I feel that you are only fooling yourself.

Remember, all I am saying, and have said throughout is that I haven't seen the evidence to support the fact man is a major causative factor in GW.

I have a tendency to accept work done and then repeated over the space 200 years as accurate, I suspect that almost all rational thinking folk do and I believe it is a very poor argument you are putting up on this topic and an exceedingly reckless one to try and discredit tried and tested work when you have done little more than read the local newspaper to formulate your own.
Meaning that anyone who disagrees with your beliefs is not rational? Now that is what I would call drawing a veeeerrryyy long bow.

It is thinking such as this that makes me so cautious, and even more certain of my choice in this case. If caution is recklessness, I guess that by your standards I am reckless, so be it.

I'm damned if I know,... I thought that I was the one urging caution here?
 
Monty

Thanks for the support on this, but it seems that your view is still somewhat sceptical relative to that of of mainstream scientists. That is you are more of a '50% sure' person rather than a '90%-99% sure' person? Is this rational given the depth of your reading?

First, we have to consider the temperature data alone. You have said yourself that the start of the recent temperature rise coincided with the start of the industrial revolution, and there is no other comparable rise or change for the last 2000 years. Although this data alone this does not discount non-anthropogenic effects it does sway the evidence largely in favour of the established paradigm.

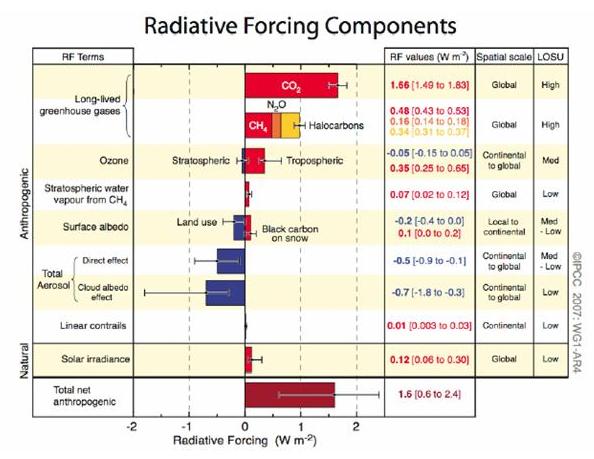
Then we have the modelling which in detail is admittedly very complex, but the order of magnitude of the greenhouse gas effects are very well known and are not disputed by anyone who has a background in the subject. It is a relatively straightforward calculation to determine the forcing of a greenhouse gas although you have to add the effects of water vapour due to the subsequent temperature rise as well. What you end up with which I am sure you are aware is a chart like this.

The main weapon of the sceptics is that the effect of solar radiation and clouds have a much bigger effect than current models predict, not that the anthropogenic greenhouse gas element is insignificant (obviously I am ignoring science illiterates). Since we know how much CO2 we emit and how much it is increasing per year (this is not disputed) we can be quite sure the anthropogenic component is significant. Whether other anthropogenic effects such as aerosols have been cancelling it out of course is another issue, which the details of the models need to sort out.
ipcc2007_radforc.jpg
 
Last edited:
I do have some reservations about the effect of the Industrial Revolution on the process though as if you read Arvid Högbom's work of the late 1890s he indicates that human activities were adding CO[SIZE=-1]2[/SIZE] to the atmosphere at a rate roughly comparable to the natural geochemical processes that emitted or absorbed the gas.

It is my belief (and means assumption in this case) that while the IR dramatically increased CO2 output much of it was absorbed by "fat in the system", it merely saturated the "environment" and as such did not have any immediate affect.

I also don't think I did say that the temperature increase coincided with the IR (and if I did it was not my intention to) what I said was that there was a noticeable change in the temperature patterns coinciding with the IR, to me the most important aspects of that graph were the decreasing amplitude and increasing wavelength trends through the IR period.


Other areas that concern me are the lack of noticeable changes during the WW1 and WW2 periods where we were discharging enough crap into atmosphere to raise CO2 levels significantly.

Like I said I believe it unlikely that we are not having an effect on the warming process I am just not yet convinced that we are at the point of no return.
 
Last edited:
Notice that in the graph it shows the greenhouse gases with no relation or comparison to the rest of the atmosphere.

Nitrogen (N2) 78 .080 Oxygen (O2) 20 .946 Argon (Ar) 0 .934 Carbon Dioxide (CO2) 0 .038 Neon (Ne) 0 .00182 Helium (He) 0 .000524 Methane (CH4) 0 .00015 Krypton (Kr) 0 .000114 Hydrogen (H2) 0 .00005


Whoah 0.038%. Did I also mention that the number one greenhouse gas is in fact water vapor? And water vapor % can vary quite wildly.

As I said, you can always show just ONE side of the data and it can look like a disaster.

For example, let's say in country A there were 2,000 automobile accidents per year and in country B there were 200. Would you rush off to conclude that country A has a horrible driving safety record?
What if I then told you that country A has 200,000,000 drivers and country B has just 3,000?

You can use and misuse maps, charts and graphs of all kinds to your ends and to your hearts content. The funny thing is when people post a graph and act like it's supposed to be some kind of conclusion.
 
Notice that in the graph it shows the greenhouse gases with no relation or comparison to the rest of the atmosphere.

Nitrogen (N2) 78 .080 Oxygen (O2) 20 .946 Argon (Ar) 0 .934 Carbon Dioxide (CO2) 0 .038 Neon (Ne) 0 .00182 Helium (He) 0 .000524 Methane (CH4) 0 .00015 Krypton (Kr) 0 .000114 Hydrogen (H2) 0 .00005


Whoah 0.038%. Did I also mention that the number one greenhouse gas is in fact water vapor? And water vapor % can vary quite wildly.

The problem with the water vapour argument is that water vapour is more predominant in the lower atmosphere where as the planets temperature is regulated in the thinner upper atmosphere and a 1% change in the balance there would have dire consequences.
 
Lewis Kaplan and Gilbert Plass when they studied radiation transmission through atmospheric layers.
 
Last edited:
Notice that in the graph it shows the greenhouse gases with no relation or comparison to the rest of the atmosphere.

Nitrogen (N2) 78 .080 Oxygen (O2) 20 .946 Argon (Ar) 0 .934 Carbon Dioxide (CO2) 0 .038 Neon (Ne) 0 .00182 Helium (He) 0 .000524 Methane (CH4) 0 .00015 Krypton (Kr) 0 .000114 Hydrogen (H2) 0 .00005

Why should anything other than the forcing components be shown? What possible relevence has Nitrogen?

It is all taken into account, this is the total forcing (W/m2) for each greenhouse forcing component (averaged over the earth) after the concentrations have been taken into account. Methane has about 20 times the warming potential of CO2 per molecule, but there is much less of it hence it only accounts for something like 20% of the warming overall.

Whoah 0.038%. Did I also mention that the number one greenhouse gas is in fact water vapor? And water vapor % can vary quite wildly.

Water vapour should be kept at a level consistent with the prevailing temperature since there is an unlimited supply from the oceans. It is therefore not a forcing component in the lower atmosphere (although it is at stratospheric levels due to the residence time) even though it is the major greenhouse gas. I don't see why this should vary wildly except gradually increase as the temperature does on a global/annual basis).

You can use and misuse maps, charts and graphs of all kinds to your ends and to your hearts content. The funny thing is when people post a graph and act like it's supposed to be some kind of conclusion.

No-one except the gutter press /web is trying to mislead you. If you don't mind me saying so you are paranoid about peer reviewed pubications, if there was a mistake this obvious, the IPCC would be hung drawn and quartered. Unfortunately Fox news, the Daily Mail and the like have no such incentive, their business is to mislead and confuse since there is always a conspiracy story for the gullible, especially when it suits peoples pockets to believe it.
 
Last edited:
I do have some reservations about the effect of the Industrial Revolution on the process though as if you read Arvid Högbom's work of the late 1890s he indicates that human activities were adding CO[SIZE=-1]2[/SIZE] to the atmosphere at a rate roughly comparable to the natural geochemical processes that emitted or absorbed the gas.

I don't see why you are so reliant on original sources, good as these were at the time, that are likely outdated based on modern measurements

It is my belief (and means assumption in this case) that while the IR dramatically increased CO2 output much of it was absorbed by "fat in the system", it merely saturated the "environment" and as such did not have any immediate affect.

It is true that the rate of absorption is an important effect, but were is the modern evidence that it was being absorbed?
co2_concentration_1750_2000_big.gif


I also don't think I did say that the temperature increase coincided with the IR (and if I did it was not my intention to) what I said was that there was a noticeable change in the temperature patterns coinciding with the IR, to me the most important aspects of that graph were the decreasing amplitude and increasing wavelength trends through the IR period.

It sounds very impressive, but to my simple mind there are more obvious trends. Are we not trying to blind oneself with science here?

Other areas that concern me are the lack of noticeable changes during the WW1 and WW2 periods where we were discharging enough crap into atmosphere to raise CO2 levels significantly.

There is a lot of evidence that there was a global dimming caused by aerosols (see previous bar chart) blocking the sunlight over much of the 20th century, it is only now we have cleaned up our act in the West that the full effect of the IR warming is being felt
 
I don't see why you are so reliant on original sources, good as these were at the time, that are likely outdated based on modern measurements

I tend to put more weight into these sources because they are honest and were carried out by people who were less enthusiastic about proving a point and more interested in explaining a phenomenon and as your CO2 graph below indicates they were right.


It is true that the rate of absorption is an important effect, but were is the modern evidence that it was being absorbed?
co2_concentration_1750_2000_big.gif
I would "guess" that the saturation band was between 1900 and 1940, but to be blunt like Seno's graph yours also cannot be used to analyse the effect of the IR as neither of them provide enough data prior to the IR to get a baseline trend pattern.

It sounds very impressive, but to my simple mind there are more obvious trends. Are we not trying to blind oneself with science here?
I would argue the opposite, I think there is an attempt to extrapolate data beyond its start date which in this case cannot be done accurately due a changing frequency pattern within the available data. This to me is not only inaccurate mathematics but it is also bad science, interestingly enough if you look at the Law Dome records for the period 1000AD to 2000AD it shows that the period corresponding to the IR had the noticeably lower CO2 levels than at any other stage.

lawdome.smooth75.gif

http://cdiac.esd.ornl.gov/trends/co2/lawdome-graphics.html

There is a lot of evidence that there was a global dimming caused by aerosols (see previous bar chart) blocking the sunlight over much of the 20th century, it is only now we have cleaned up our act in the West that the full effect of the IR warming is being felt
Now this is where I swap sides, tell me how many aerosols does it take to equal half of Europe's cities being on fire for 5 years?

From 1914 to 1945 we fired and dropped millions if not billions of tons of bombs on each other, we set fire to damn near every city in Germany for three years, we set fire to damn near everything between London and Moscow and we barely get a peak please excuse me if I am less concerned about a couple of cans of hairspray.

Now here is the thing I am not arguing with your data I am happy to accept it for what it is (a trend graph for the period 1750-2000) and to be honest it corresponds to work done in 1890, 1930, 1950 and 1960 (see that is why I like the earlier work as without understanding a trends past you cannot understand its future) but there is a lot still to be explained and understood and I am not the type of person that likes to gloss over holes while I wave my arms in the air and shout that the sky is falling.
 
Last edited:
Now this is where I swap sides, tell me how many aerosols does it take to equal half of Europe's cities being on fire for 5 years?

From 1914 to 1945 we fired and dropped millions if not billions of tons of bombs on each other, we set fire to damn near every city in Germany for three years, we set fire to damn near everything between London and Moscow and we barely get a peak please excuse me if I am less concerned about a couple of cans of hairspray.

Interesting point considering our dual interest in such things. It is not aerosol cans or smoke but sulphate's and nitrate droplets formed in large amounts by power station emissions which are the main culprit. These can be very small but can form nucleation sites for water droplets and hence white clouds which reflect light. Hence you don't need a lot of mass to cause a large effect. Spray cans are nothing to do with it although these did contain CFCs which are potent greenhouse gases which would have the opposite effect. Dark particulate from smoke can work both ways depending on the blackness, they can form nucleation sites reducing light or reduce the surface reflectivity of the polar caps particularly the North, increasing warming in the long run.

Looking at a graph of temperature on a century timescale we find that temperatures did seem to start dropping from around the end of WW2 although perhaps that was due to the increase in industry rather than the aftermath of city fires. Were there not more bombs dropped on Vietnam than in the Second world war? Note also the deliberate burning of forests such as in Indonesia cause a lot of particulate.

global_temp1.jpg
 
Last edited:
Interesting point considering our dual interest in such things. It is not aerosol cans or smoke but sulphate's and nitrate droplets formed in large amounts by power station emissions which are the main culprit. These can be very small but can form nucleation sites for water droplets and hence white clouds which reflect light. Hence you don't need a lot of mass to cause a large effect. Spray cans are nothing to do with it although these did contain CFCs which are potent greenhouse gases which would have the opposite effect. Dark particulate from smoke can work both ways depending on the blackness, they can form nucleation sites reducing light or reduce the surface reflectivity of the polar caps particularly the North, increasing warming in the long run.

Looking at a graph of temperature on a century timescale we find that temperatures did seem to start dropping from around the end of WW2 although perhaps that was due to the increase in industry rather than the aftermath of city fires. Were there not more bombs dropped on Vietnam than in the Second world war? Note also the deliberate burning of forests such as in Indonesia cause a lot of particulate.

But this is the point I am trying to make, we have an end result (increasing temperatures and CO2 levels) but what we don't have is a complete understanding why this is happening.
I find it difficult to point to the IR as a an example of the problem when we have the WW1 and WW2 period where we under went a similar level of industrial development and are not seeing similar results if anything we see reversal of the trend with the coldest and longest winters of the century.

My argument is not that there is no global warming any idiot can see that but more that we do not fully understand the interactions causing it and as such it is just as dangerous to jump the gun and blame it all on man as it is to sit back and deny any of it is mans fault.
 
There is a lot of evidence that there was a global dimming caused by aerosols (see previous bar chart) blocking the sunlight over much of the 20th century, it is only now we have cleaned up our act in the West that the full effect of the IR warming is being felt


But surely we were told for many years that a greast irrepairable hole in the ozone layer had the opposite effect of dimming?

Has this now disappeared; has the science changed?
 
But this is the point I am trying to make, we have an end result (increasing temperatures and CO2 levels) but what we don't have is a complete understanding why this is happening.

Climatologists do add the additional natural components, such as solar irradiation and volcanoes. Note volcanic activity which introduces large amounts of sulphur into the atmosphere increased after 1945 coinciding with the lull in temperatures.

faq_increase.png


note deliberately releasing sulphur into the atmosphere is being considered as a means of cooling the earth.

I find it difficult to point to the IR as a an example of the problem when we have the WW1 and WW2 period where we under went a similar level of industrial development and are not seeing similar results if anything we see reversal of the trend with the coldest and longest winters of the century.

Perhaps on a local level, but not globally look at the temperature graph again

My argument is not that there is no global warming any idiot can see that but more that we do not fully understand the interactions causing it and as such it is just as dangerous to jump the gun and blame it all on man as it is to sit back and deny any of it is mans fault.

As I have said no climatologist would be so naive to do this, the established view is that the warming over tha last century is a combination of several sources, but the anthropogenic component is dominant. Warming over the last few decades ignoring short term cyclic events such as ocean currents and the solar cycle is almost entirely anthropogenic.
 
Last edited:
You still haven't answered this point:
Many of the sensing stations have been affected because of the urban heat island effect. Cities as they grow bigger and bigger also grow hotter and hotter. Many of these sensors, even if they were not on the edge of the towns or cities have been affected by this phenomenon.
The thing is, when I am near a city, I do feel like the world is getting hotter. But when I was stationed FAR from any city, I felt no such thing. I do have a feeling that the data is being exaggerated by not filtering out the urban heat island effect. I don't know how they'd do that properly either. You'd have to define the parameters for "urban." Does a town of 4,000 count as "urban?"
As for climate changing, climate always changes. What I do think is going on though is that it feels as though if winter takes a longer time to show up and takes a longer time to go away. It's almost like the whole thing's been shifted. (Why I've had sunshine and warmth in December in Austria but had snow well into March).
So like I said, the graphs are nice and all but we need a LOT more information on how they defined those, where the sensors were, what times of the year they picked the data, how the sensors are set up (some idiots in the past could have conveniently put their thermometers under the shade to prevent their new flashy equipment from being damaged by rain) etc.
Also in every experiment there's always this sort of phenomenon. Experimenters often get the result that they WANT to see. Even during their neutral testing, bias does come into play at points.
Another reason for getting higher temperatures could be that developing countries have, for the past fifty or forty years, been collecting temperature data. And guess what? A lot of these countries also tend to be very hot places.

But as for being responsible, that's another matter.
I take public transportation whenever I can.
I walk whenever possible.
I have a partitioned garbage bin where I have paper, plastic and metal separated.
I reuse paper whenever I can.
I try to reuse bottles whenever I can.
I don't throw trash everywhere.
Although I don't take part in environmental campaigns anymore, I still try to be environmentally conscious.
 
Last edited:
Back
Top