perseus
Active member
Alright here's my issues with the data you represented.
Here's the full report of Quantifying the influence of anthropogenic surface processes and inhomogeneities in gridded global climate data (I assume you know what this means without looking it up).
http://icecap.us/images/uploads/MM.JGRDec07.pdf
There's a review of this paper here which answers your query
http://www.realclimate.org/index.ph...ds-affected-by-economic-activity-ii/#more-507
They rely on the fact that these measurements are derived using the very same type of physical laws as those predicting an enhanced greenhouse effect due to increased GHG levels
")
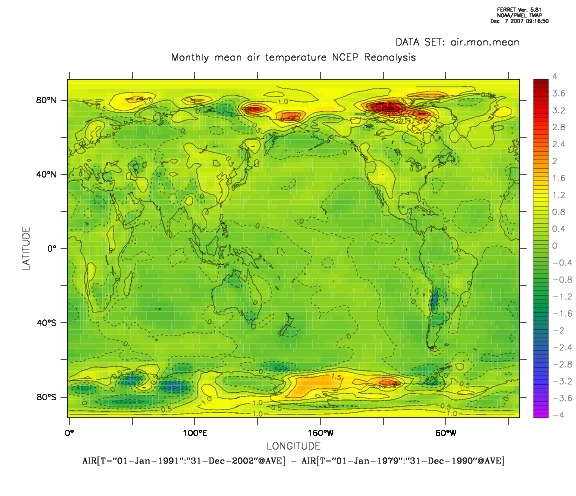
(this is what I said)I also think that M&M2007 is biased and gives an incorrect picture, as they do not discuss the fact that also the world oceans are warming up, and whether any economic activity can take the blame for that. I think it is difficult to argue that factors such as the urban heat island effect plays an important role here.
They split the data by randomly picking points which were either used for training the data or validating the model, thus data from adjacent sites which are related will end up in the different batches for training or validation.
I think the results of M&M2007 analysis and conclusions are invalid because
- They do not properly account for dependencies (this is a statistical requirement for valid analysis)
- They over-fit the regression.
- Their results look unreasonable (by this he means some of the greatest anomolies are for non-urban areas, you would except the opposite)
- They "cherry pick" the MSU data that gives the lowest trend
Other issues include that the timeframe was not ideal picking up natural fluctuations and economic activity was spead over an entire country (in other words Moscow would be compared with Siberia!)
Once corrected most of the local effects 'melt' away
Last edited: